Fractals
I thought I would try and put together a little fractal visualization. Specifically, the Mandelbrot set, since it is so well-known and simple to implement. And there's a whole wikipedia page devoted to Plotting Algorithms for the Mandelbrot Set. I just wanted to do something quick and simple to learn a bit about how these visualizations work.
The Mandelbrot set is defined as the set of points in the complex plane where the series z_n = z_(n-1)^2 + c remains localized and does not diverge. Since we're squaring, if z^2 > 1, then we're diverging. But how in general do we decide if a point is going to diverge? Well, one of the reasons I love numerical methods is their simplicity. We just grind through a whole bunch of iterations and see if we ever cross that frontier. If we're looking at a complex number z = x + iy, we can do something like:
def escape_steps(real, imag):
    steps = 0
    max_steps = 1000
    x = 0
    y = 0

    while steps < max_steps and (x*x + y*y <= 4):
        x, y = (x*x - y*y + real), (2*x*y + imag)
        steps += 1
    return steps
This simple function tells us how many iterations before the point 'escapes'. We can then use this to scale some sort of color gradient. To make a nice visualization, we just need to do this for every pixel. I started to build such a visualization with Raylib, but I realized that applying the same transformation for each pixel is exactly what shaders are designed to do. I don't know anything about shaders, but this seemed like a great opportunity to learn something. So I went to Shadertoy and tried to implement my naive little visualization.
int escape(float x0, float y0) {
    int steps = 0;

    float x = 0.0f;
    float y = 0.0f;

    while (x*x + y*y <= 4.0f && steps < 1000) {
         float temp = x*x - y*y + x0;
         y = 2.0f*x*y + y0;
         x = temp;
         steps += 1;
    }
    return steps;
}

void mainImage( out vec4 fragColor, in vec2 fragCoord )
{
    float scaling =  2.0f;
    float x_offset = 0.5f;
    float y_offset = 0.5f;

    vec2 uv = fragCoord/iResolution.xy;
    float x0 = (uv.x -x_offset) * scaling;
    float y0 = (uv.y -y_offset) * scaling;

    int steps = escape(x0, y0);
    float scale = float(steps) / 256.0;

    vec3 col = vec3(scale, scale, scale);

    // Output to screen
    fragColor = vec4(col,1.0);
}
And behold, this produces a very basic image:
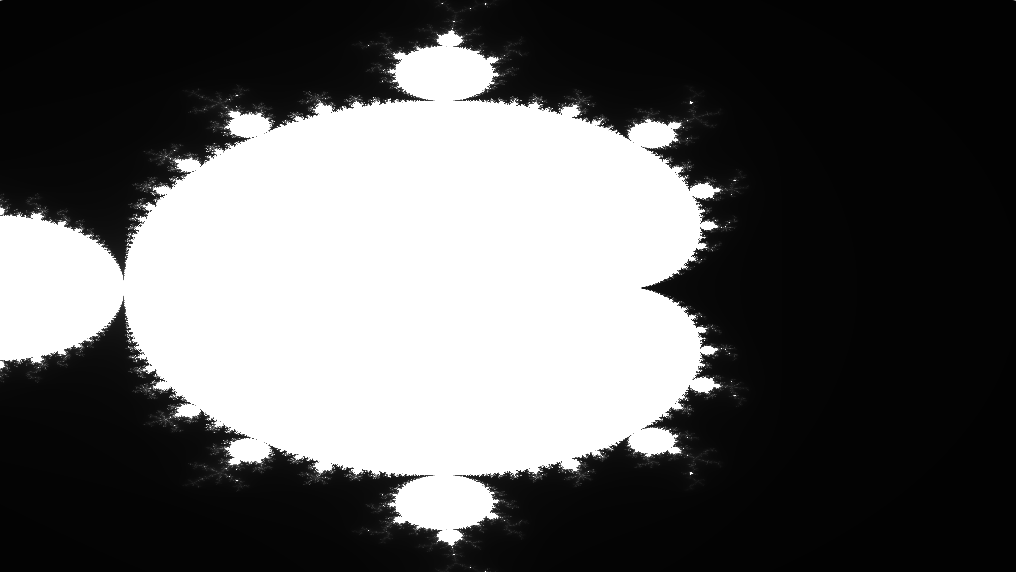
After a little more fiddling with the scaling and offsets and learning how shadertoy gives you time and frame data, we can animate it a bit. As we zoom in, we are actually seeing fractal patterns repeating at different length scales. Neat!